
The top of the page
These controls stay in place on every tab.- Scope badge. Next to the title, it says what you’re looking at: Company or a department’s name.
- Period. Choose Today, 7 days, 30 days or 90 days. Every figure, and every “vs the previous…” comparison, follows it.
- Refresh reloads the figures. Updated shows when they were last loaded.
- Export downloads the team figures as a CSV, for Leads and Admins. See Exports.
- Set up Synapse appears until your organization finishes setting up. It shows the next step, such as connecting GitHub or choosing knowledge sources, and links to the setup guide.
Overview
Overview shows the AI Effectiveness Index as three cards side by side, one for each part. They’re separate measures. Don’t add them up or compare one with another. Each card opens its own tab.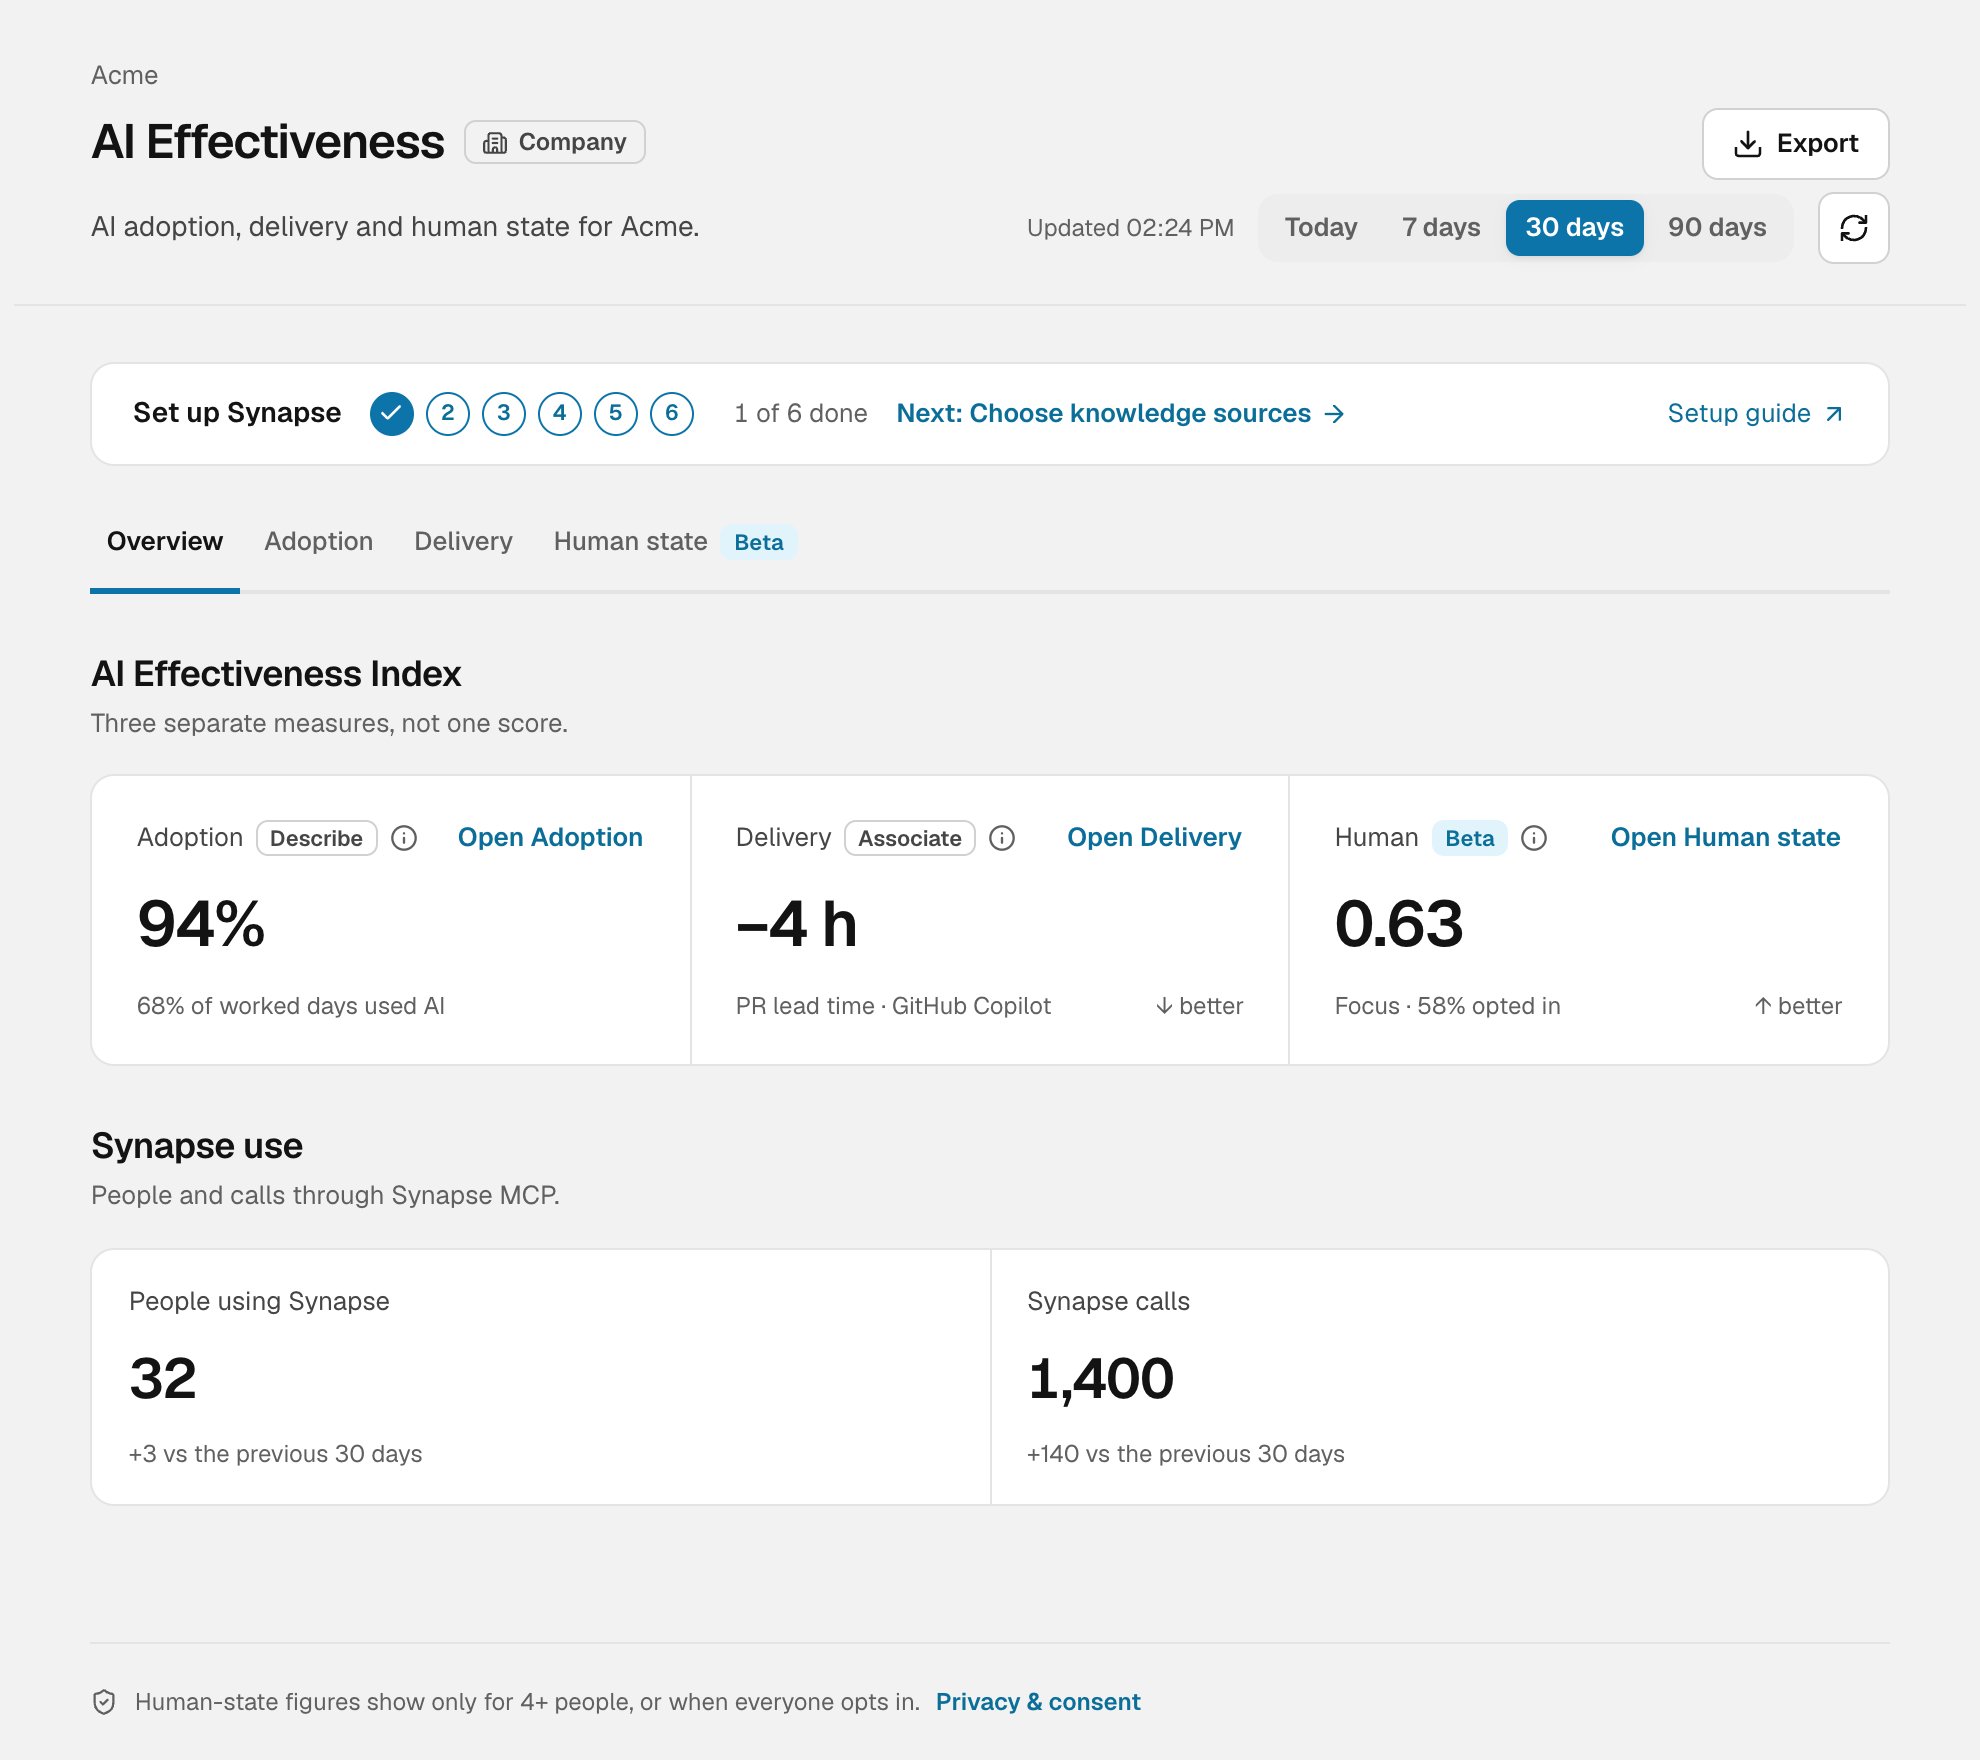
Overview, with the AI Effectiveness Index and Synapse use
Arrows such as ↓ better say which way is good for that measure. For PR lead time, a negative change means PRs merged faster after the rollout.
The Delivery card needs a recorded AI rollout. Until there is one, it says No AI rollout recorded yet rather than showing a number. If the newest rollout is still inside its 4-week “after” window, the card says so and shows the last complete one.
Synapse use, below the index, shows People using Synapse and Synapse calls: how many people and how many calls went through Synapse MCP in the period, with the change from the previous one.
Adoption
Adoption answers “who uses AI tools, and how often?” It’s labelled Describe: it counts use, and doesn’t say whether AI helped.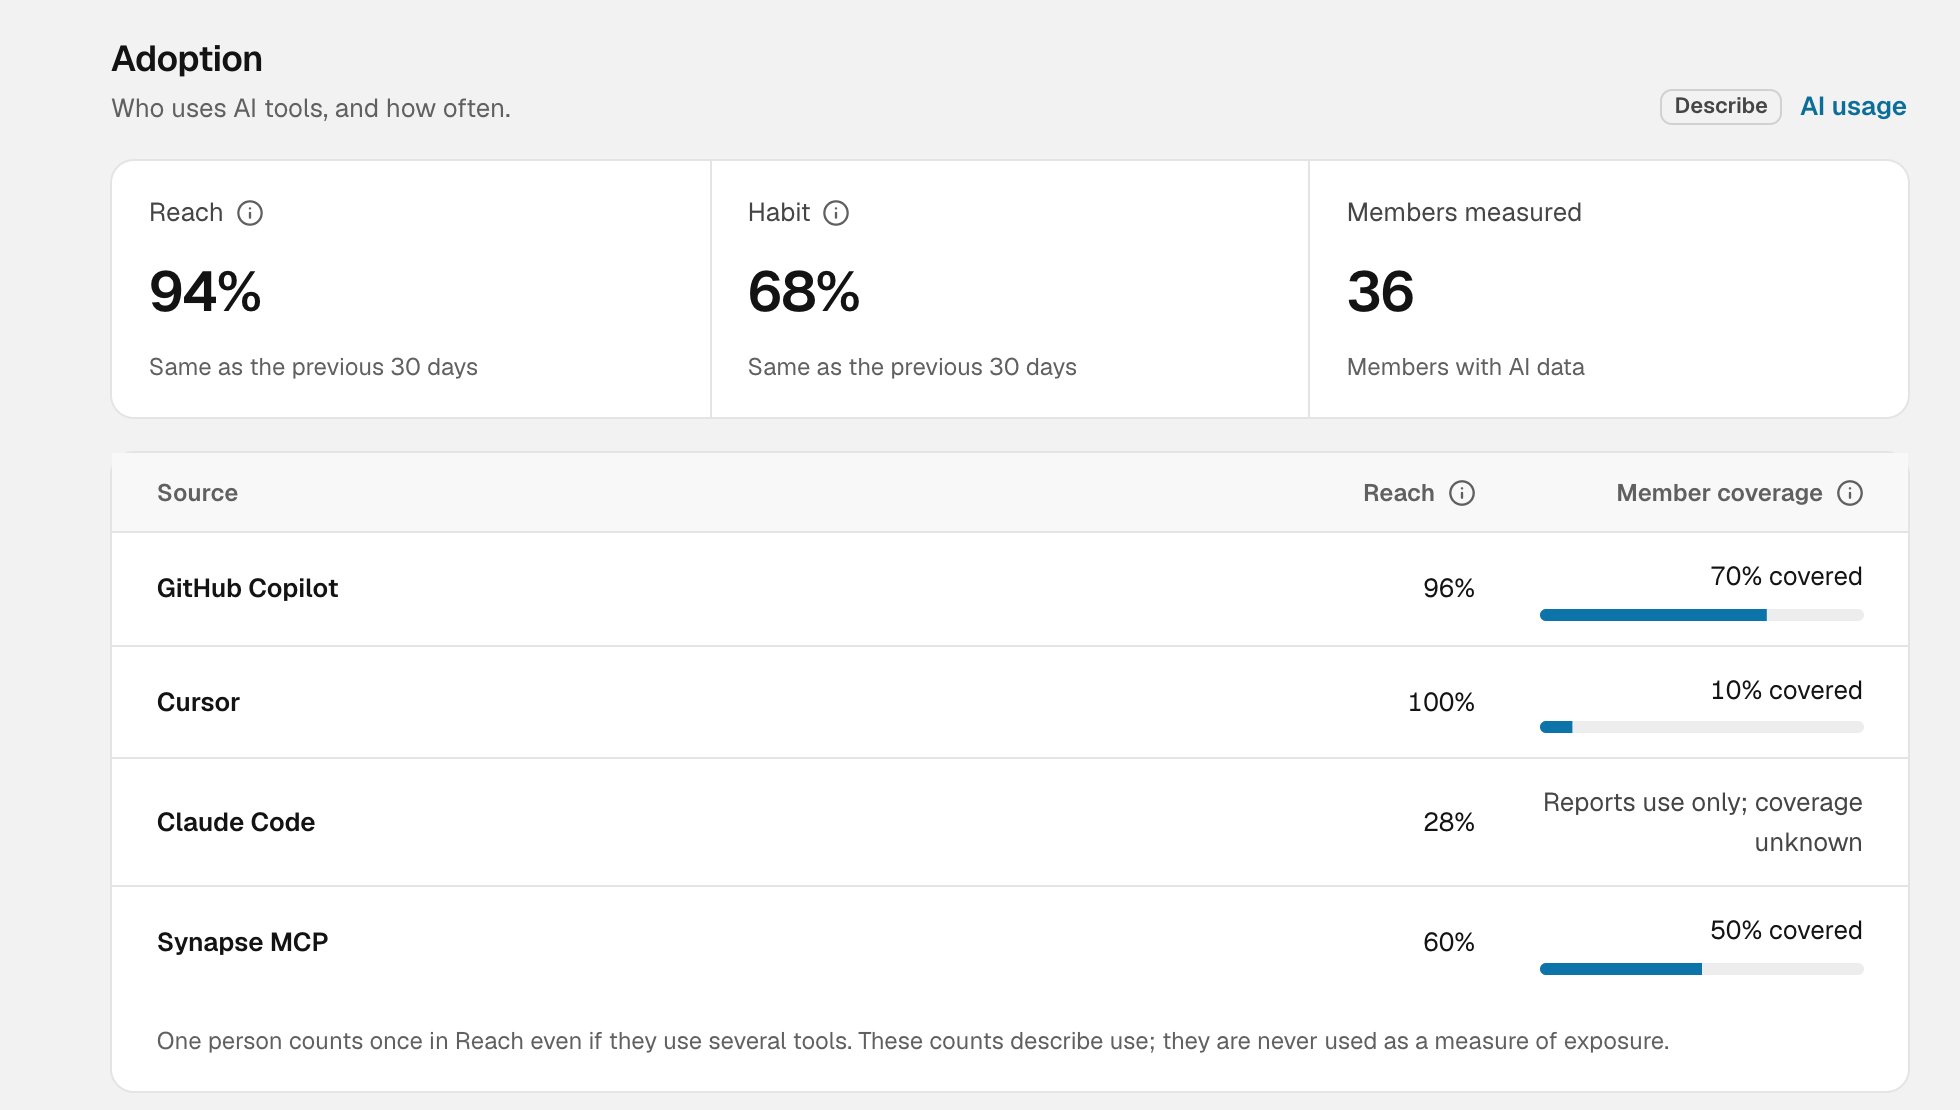
Adoption, with Reach, Habit and the by-source table
- Reach. The share of measured members who used any AI tool in the period.
- Habit. The share of worked days on which people used AI.
- Members measured. How many members Synapse has AI data for. Reach and Habit are shares of these people, not of everyone in the team.
- Reach is the share of members covered by that tool who used it.
- Member coverage is how many of the team’s members that tool reports on. A tool that reports use without saying who it covers shows Reports use only; coverage unknown.
- AI tools in use shows active people by tool and links to AI usage for the full breakdown.
- Synapse shows calls through Synapse MCP over time (daily, weekly or monthly) and Top Synapse clients, the AI clients that made those calls.
Delivery
Delivery shows the work your organization shipped and how AI shows up in merged PRs: lead time, deploys, review times, CI, and Repository AI evidence. It’s labelled Associate: a change alongside AI use isn’t proof that AI caused it. Every metric on this tab is explained in Metrics explained.Human state
Human state shows how people are doing during work, from members who connected Life by Synheart and consented. It’s in Beta, and it’s never used in alerts, goals, rankings or recommendations.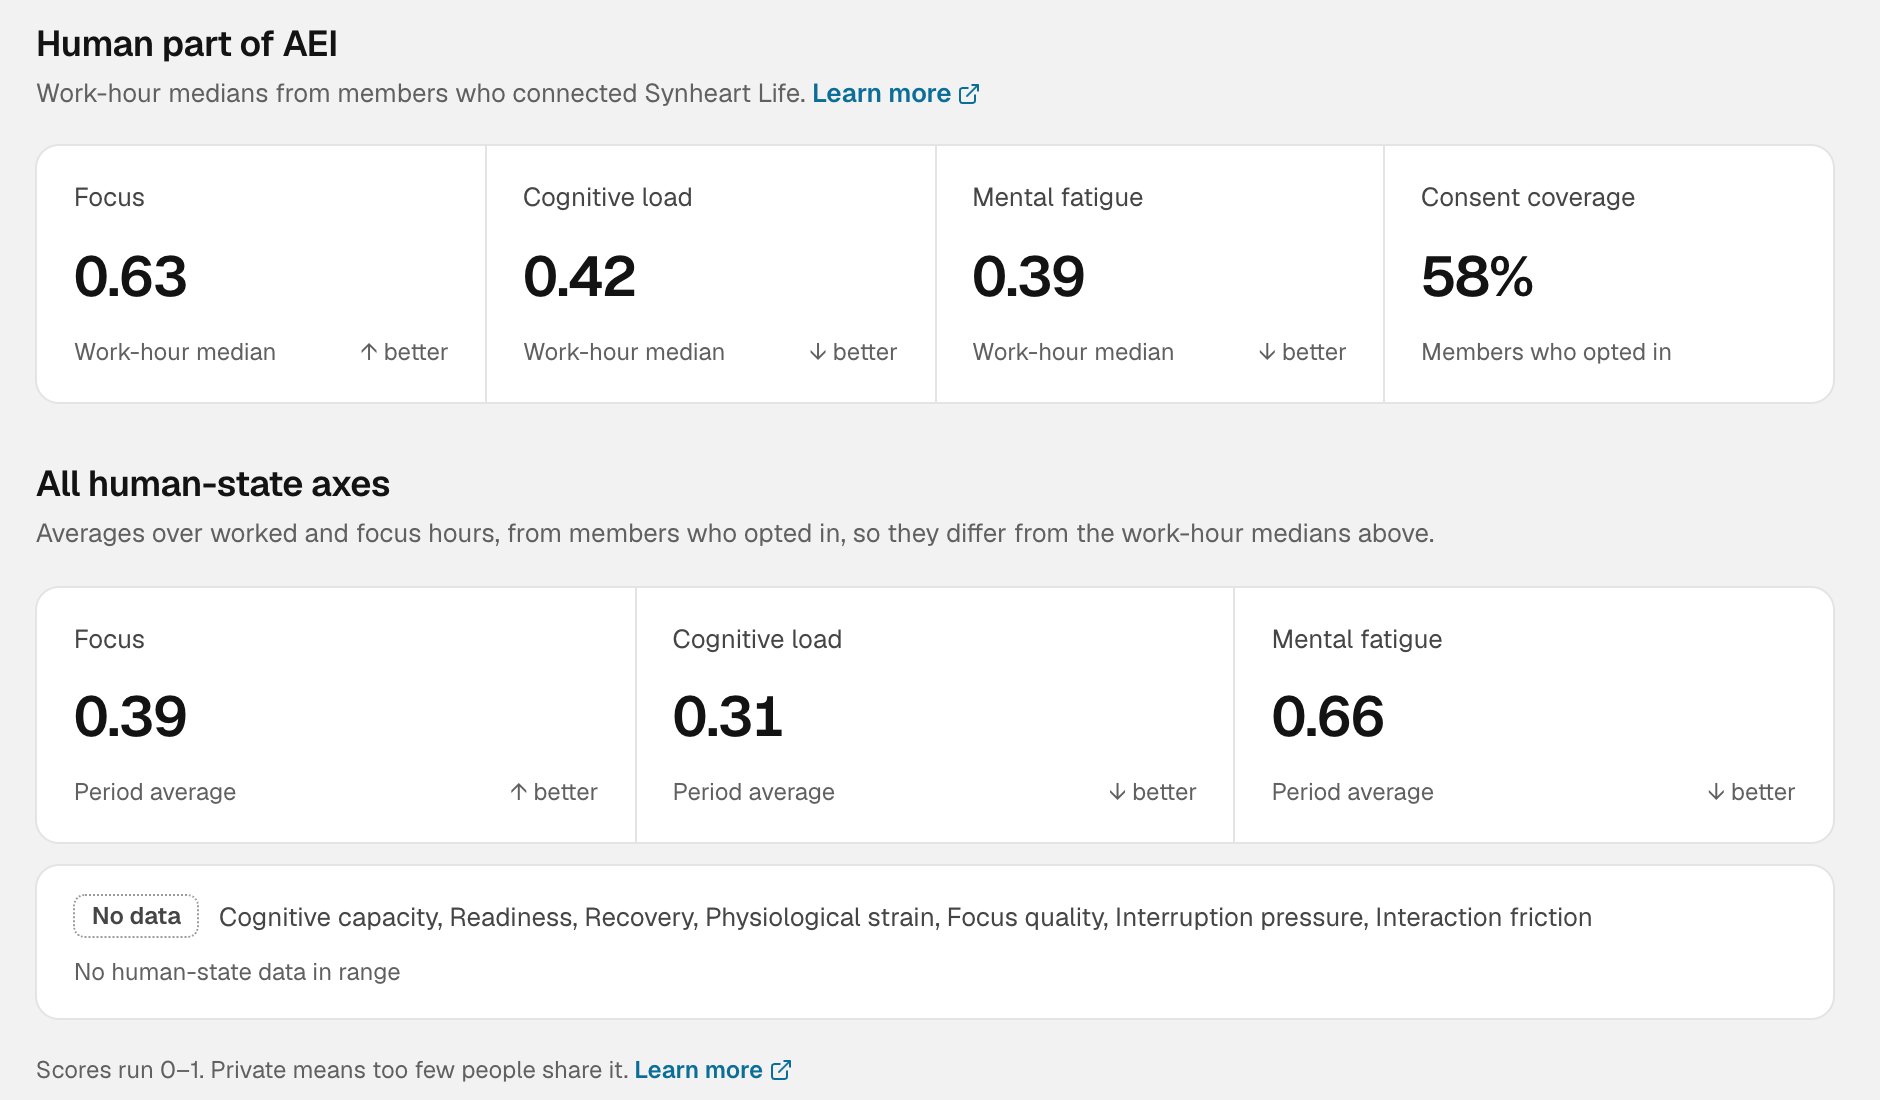
Human state, with the human part of AEI and all human-state axes
- Focus, Cognitive load and Mental fatigue, each as the team’s median during work hours. Higher focus is better. Lower load and fatigue are better.
- Consent coverage, the share of the team’s members who opted in. A low share means the figures describe only part of the team.
- Work rhythm shows Deep work and Meeting load: how the team’s work time is spent.
- Human-state loop follows agent calls through four steps: Synapse calls, calls that asked for human state, calls where a state was available, and calls that led to a directive (guidance to the agent on how to respond). It counts requests, not people.
- Evidence coverage shows how much of each input the period has: Synapse MCP, consented human state, and work context.
When figures are hidden
Human-state figures follow the cohort floor. A footer on every tab says how many people a figure needs. Below that, you’ll see a dash or Private instead of a number, unless everyone on the team has opted in to sharing with each other. If an admin has turned off team human-state views, this tab and the Human card say the views are off. Adoption and Delivery aren’t affected.Reading it well
- Read each part on its own. High adoption with flat delivery is a finding, not a contradiction.
- Check coverage first. Members measured, member coverage and consent coverage tell you how much of the team a number speaks for.
- Look for patterns over periods. One week is noisy. Compare 30 or 90 days.
- Don’t use it to rate people. Every figure is a team total, and none of them is a performance score.